
Report on the 17th iPERC Seminar
- 2024/10/30
On February 27, 2024, “Dr. Warren’s Journal Club” was held at the innovative Photonics Evolution Research Center (iPERC) in Shizuoka University. Dr. Warren is a biomedical specialist and belongs to the Hamamatsu Ventures USA, Seattle, WA, which is a US subsidiary of Hamamatsu Photonics K.K.
In the Journal Club, students from Shizuoka University and Hamamatsu University School of Medicine selected one English academic paper under the supervision of Dr. Warren and assigned roles to present it. During the presentation, Dr. Warren and participants discussed the content of the presentation with the presenters. Dr. Warren visited the Hamamatsu campus of Shizuoka University, and the event was held in a hybrid format combining an in-person meeting with Zoom meeting. The presenters were Mr. Kota Ohara, a fifth-grade medical student and Ms. Yuna Tomochika, a fourth-grade medical student, both from Hamamatsu University School of Medicine; Ms. Ayaka Yoshino, a second-grade doctoral student in the Graduate School of Integrated Science and Technology, Department of Information Science, Shizuoka University; and Mr. Kwen Hyeun Woo, a second-grade doctoral student in the Department of Nanovision Technology, Shizuoka University.
The Journal Club focused on a paper “Multimodal optical imaging with real-time projection of cancer risk and biopsy guidance maps for early oral cancer diagnosis and treatment” by J.B. Coole and his co-workers from Rice University, US *1. This paper proposes a portable, low-cost Active Biopsy[1] Guidance System (ABGS) to support the early detection and treatment of oral cancer. The ABGS is expected to assist in identifying early-stage lesions and selecting appropriate biopsy sites by analyzing wide-field autofluorescence[2] and high-resolution microscopic images with deep learning[3] to create a cancer risk map, which is projected directly onto biological tissue as a biopsy guidance map in real time.
Presentation Summary
Ms. Yuna Tomochika, Hamamatsu University School of Medicine
Ms. Tomochika explained the symptoms, risk factors, diagnostic methods, and issues with conventional approaches to oral cancer, highlighting the importance of early detection. She noted that many cases of oral cancer are preceded by symptoms indicative of oral potentially malignant disorders (OPMD[4]) or oral epithelial dysplasia (OED[5]), which can be identified through microscopic examination. Diagnosing OED typically involves perform biopsy on oral lesions, but even experienced clinicians have difficulty to choose when and where to perform a biopsy. She explained how the ABGS could address this issue. ABGS provides cancer risk and biopsy guidance maps using wide-field autofluorescence and high-resolution microscopic imaging, potentially aiding in the early detection of oral cancer and its precancerous conditions.
Mr. Kwen Hyeun Woo, Shizuoka University
Mr. Woo described the structure, principles, and workflow of ABGS. The system acquires wide-field autofluorescence images and high-resolution microscopic images, which are then analyzed using a deep learning program to produce an integrated cancer risk assessment. This information is projected inside the patient’s mouth as a biopsy guidance map. He also discussed the evaluation of the spatial resolution and misalignment of the camera and projector used in the system.
Mr. Kota Ohara, Hamamatsu University School of Medicine
Mr. Ohara explained the application of the ABGS system to three actual patients as demonstrated in the paper. For Patient 1, the full ABGS workflow was performed on a lesion on the right side of the tongue. The microscopic images of patient 1 were evaluated using high-resolution mosaic analysis, showing that the MTN score[6] for high-risk areas was higher than that for low-risk areas, with a tendency for nuclei to be dense and enlarged more in high-risk areas. The clinician performed biopsies on three sites deemed clinically suspicious (two high-risk and one low-risk areas), and pathological examination confirmed moderate to severe dysplasia[7]. For Patient 2, cancer risk maps were created using wide-field white light and autofluorescence imaging, which were projected onto the oral mucosa to identify high-risk areas. Finally, for Patient 3, cancer risk maps created with wide-field white light and autofluorescence imaging were projected onto the oral mucosa, and microscopic images were obtained from the high-risk areas. After multimodal image diagnosis, surgical resection was performed based on the cancer risk maps. Histopathological analysis confirmed moderately differentiated invasive squamous cell carcinoma[8].
Ms. Ayaka Yoshino, Shizuoka University
Ms. Yoshino explained the discussion section of the paper. The proposed system projects cancer risk maps and biopsy guidance maps, generated through multimodal imaging diagnosis, directly onto the patient’s tissue in real-time, guiding biopsies to high-risk areas. The advantages of this system include reducing human error by projecting diagnostic maps onto the target area, enabling clinicians to work more accurately. Additionally, the system is noted for its low cost, ease of scalability, and versatility. Next, she explained the diagnostic scoring used in the study. The MTN score by combining nuclear and keratin segmentation with internal quality checks employed in this study showed superior performance compared to previous algorithms. Further improvement of the system was suggested, such as expanding the measurement range using high frame rate[9] microscopy to enhance the diagnostic capability of the system. Providing real-time visual guidance helps clinicians accurately identify high-risk areas and guide biopsies. Finally, she discussed the potential of this system to significantly improve diagnostic accuracy and patient care.
Paper Summary
Oral cancer is a significant global health issue, and its early diagnosis plays a crucial role in reducing treatment-related morbidity[10] and improving long-term survival rates. Oral cancer lesions are diagnosed through biopsy, but even experienced clinicians have difficulty to choose the optimal timing and specific tissue sites for biopsy. The authors proposed an Active Biopsy Guidance System (ABGS) to support the early detection of oral cancer. ABGS integrates multimodal optical imaging and deep learning algorithms to generate cancer risk maps and biopsy guidance maps, which are projected in real-time directly onto the patient. This enables clinicians to quickly identify high-risk areas and select appropriate biopsy sites. This innovative system aims to contribute to the early detection of oral cancer, improve patient outcomes[11], and enhance survival rates.
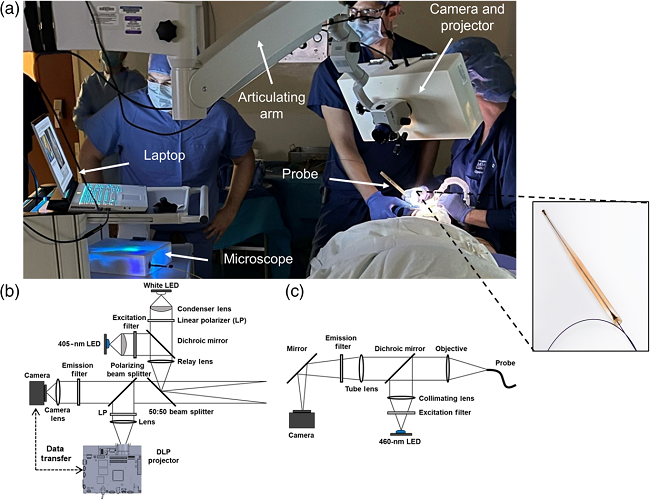
As shown in Figure 1, ABGS comprises a camera for wide-field white light and autofluorescence imaging, a projector for projecting cancer risk maps, and a microscope equipped with a fiber optic probe. The system guides clinicians in using wide-field autofluorescence and microscopic imaging techniques to determine the necessity of a biopsy, targeting the early detection of oral cancer and its precancerous lesions.
Fig. 1 Optical system and clinical implementation of the ABGS: (a) ABGS in use in an operating room, with an inset showing an enlarged view of the microscope imaging probe. (b) Optical diagram of the ABGS camera and projector. (c) Optical diagram of the ABGS microscope.
(LED: Light Emitting Diode, DLP: Digital Light Processing.)
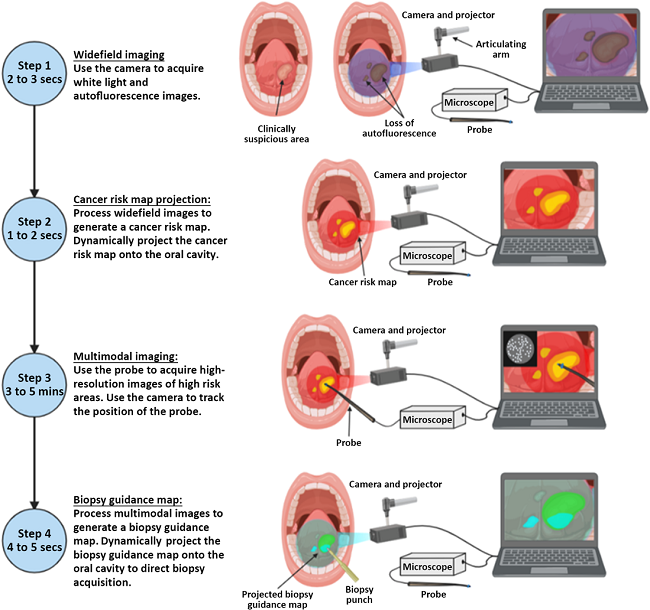
The ABGS workflow, shown in Figure 2, involves the steps of wide-field autofluorescence imaging, cancer risk map generation, microscopic image acquisition and probe position tracking, and biopsy guidance map projection onto the oral cavity. Cancer risk maps are generated from deep learning algorithms and wide-field autofluorescence imaging. The integration of multimodal imaging enhances the early detection of oral cancer and its precancerous lesions, ultimately improving patient outcomes.
Fig. 2 ABGS imaging workflow. (Step 1: Wide-field images are acquired using the camera and projector. Step 2: A cancer risk map is generated and projected into the oral cavity. Step 3: Microscopic images are acquired from high-risk areas, Step 4: Multimodal image data is processed to generate a biopsy guidance map, which is projected into the oral cavity.)
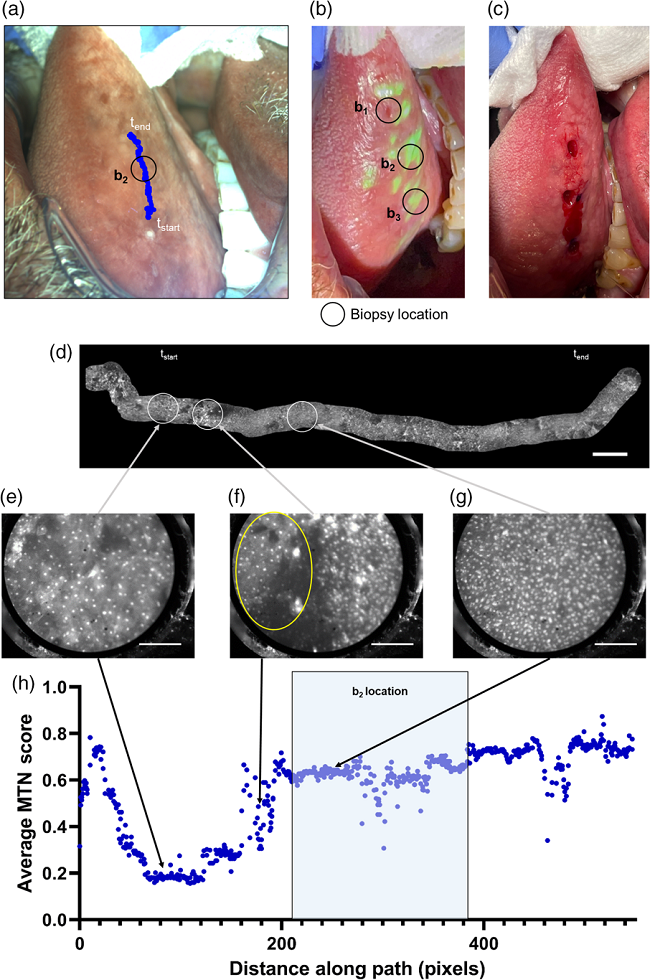
Figure 3 shows the diagnostic results of the right lateral tongue lesion by ABGS. Biopsies were performed in both clinically suspicious areas and areas highlighted by the biopsy guidance map (see Figure 3(b)–(c)). Microscopic images were analyzed to generate a high-resolution mosaic image with a width of 16.3 mm (see Figure 3(d)). The average MTN score was calculated for each pixel in the microscopic images. Figures 3(e)–(g) are microscopic images with normal nuclei for low-risk regions, microscopic images showing the transition region between normal nuclei and areas of dense and enlarged nuclei, and microscopic images with dense and enlarged nuclei from high-risk regions. Areas with high MTN scores correspond to both the clinically suspicious areas and those highlighted by the biopsy guidance map. Pathological examination confirmed moderate to severe dysplasia in these areas. In conclusion, the active biopsy guidance system, which projects cancer risk and biopsy guidance maps to the patient in real time, has proven effective and is expected to improve the accuracy of biopsy site selection.
Fig. 3 Analysis of multimodal imaging in a lesion in the right lateral tongue. (a) WL image of clinically suspicious area, (b) WL image with the biopsy guidance map projected onto the oral cavity, (c) image of biopsy taken after multimodal imaging, (d) High-resolution mosaic image generated from multimodal imaging data, (e) Microscopic image showing normal nuclei, (f) Microscopic image showing the transition area between regions with normal nuclei (yellow oval) and regions with dense and enlarged nuclei, (g) Microscopic image showing dense and enlarged nuclei. (h) Relationship between the average MTN diagnostic score obtained from the microscopic images and the distance along the imaging path.
Q&A Summary
Q1: How long should mild symptoms in the oral cavity persist before seeing a doctor for early detection of oral cancer?
Presenter: “For patients undergoing regular health check-ups, their dentist might detect oral lesions earlier than the patient might notice them.”
Dr. Warren: “Generally, it is recommended to seek medical attention if symptoms persist for more than three weeks. Advanced diagnostic techniques, such as ABGS, could potentially enable earlier detection.”
Q2: Regarding imaging step 3, it mentions that it takes 3 to 5 minutes. Isn’t it difficult for the patient to keep their tongue still during this time?
Presenter: “Yes, it is challenging for the patient to keep their tongue still for 3 to 5 minutes. During this time, the probe needs to scan the entire area, so the patient must avoid moving their tongue.”
Dr. Warren: “If the patient moves their tongue, steps 1 and 2 might not be affected, but steps 3 and 4 may require starting the process over. While it might be possible to correct for movement, this study did not address that.”
Q3: Is oral cancer limited to the tongue, or can it occur anywhere in the mouth?
Presenter: “Oral cancer can occur not only on the tongue but throughout the entire oral cavity. Different locations of cancer may require more complex scanning.”
Q4: For example, in the case of breast cancer, you can palpate it yourself to determine whether it is benign or malignant, but what about oral cancer?
Dr. Warren: “Oral cancer can be more difficult to assess compared to breast cancer, but if any abnormalities persist for more than two weeks, it is advisable to consult a physician.”
Q5: How do you distinguish between normal tissue and cancerous tissue?
Presenter: “Cancerous tissue often shows decreased autofluorescence compared to normal tissue, which is a sign of a tumor. Additionally, the amount of porphyrin is important; cancerous tissue lacks lymphatic systems that normally expel porphyrin, leading to higher porphyrin intensity.”
Dr. Warren: “Collagen signals also change. The ratio of porphyrin to collagen signals can be used to distinguish between normal and cancerous tissue.”
Q6: What is the observation depth of the microscope used in this technology?
Presenter: “The confocal microscope used is suitable for relatively superficial observations, not deeper tissue.”
Q7: Why are so many microscopic images needed?
Presenter: “Multiple microscopic images are needed to compare hints from each point. Using high frame rates for capturing multiple images improves the quality of the results.”
Dr. Warren: “The study might have overly dense data sampling. Lower sampling density might be acceptable, and moving the microscope fiber probe faster (e.g., 30 seconds to 1 minute) could be feasible. Increasing the probe size could also be considered.”
Q8: How was the algorithm for detecting cancer developed?
Dr. Warren: “The algorithm was trained using various types of cancer cells, including cancer and severe dysplasia, from previous studies. In this study, biopsies from three patients were compared with the algorithm’s results, showing a good match. However, validation with only three patients is not sufficient, and more patients are needed to enhance reliability.”
Q9: What was the most impressive aspect of the study or the aspect that was well done? (Dr. Warren)
Presenter: “The implementation of quality check functions was crucial for performance improvement. The ability to observe with short exposure times and the patient’s compliance in remaining still were the most impressive aspects.”
Q10: How could this study be improved? (Dr. Warren)
Presenter: “One approach could be to use a larger probe initially and then switch to a smaller probe if suspicious areas are detected.”
Participant: “Making the detection possible with a smartphone camera and utilizing AR/VR technology could also be explored.”
Comment
The paper presented was highly suitable for the journal club as it combined wide-field autofluorescence imaging, high-resolution microscopy (engineering and medicine), and deep learning (informatics). I was impressed by how the ABGS device supports the selection of biopsy sites for oral cancer and aids in the early detection and diagnosis of cancer. My own research focuses on quantitative biomedical imaging using CMOS image sensors for early diagnosis of burns and diabetic foot ulcer, making this study particularly relevant to my interests. Through the journal club, there was lively discussion about the paper among both students and faculty members. The opportunity to engage in discussions at the intersection of engineering, medicine, and informatics was very valuable. Finally, I would like to express my sincere gratitude to Dr. Warren for supervising the journal club, to the students who prepared the presentation materials, and to everyone involved from Shizuoka University and Hamamatsu University School of Medicine.
References
*1 J. B. Coole et al., “Multimodal optical imaging with real-time projection of cancer risk and biopsy guidance maps for early oral cancer diagnosis and treatment,” J Biomed Opt., 28(1), 016002 (2023).
Notes:
[1] Biopsy: Also known as biological tissue diagnosis, the procedure involves obtaining a sample of body tissue for examination, usually under a microscope, to diagnose disease.
[2] Autofluorescence: Fluorescence emitted by chemical substances constituting living organisms, such as proteins, nucleic acids, and low molecular weight compounds, which absorb and emit irradiated light (usually of longer wavelength than the irradiated light). This is different from the fluorescence of artificially added fluorescent markers.
[3] Deep learning: A machine learning technique that uses neural networks that reproduce the mechanisms of human neurons, characterized by the use of multilayered neural networks.
[4] OPMD (Oral Potentially Malignant Disorders): A potentially malignant oral lesion (precancerous lesion) is a lesion that is not yet causing symptoms but is clearly abnormal and highly suspicious of malignancy.
[5] OED (Oral epithelial dysplasia): A lesion that shows structural and cellular atypia of the epithelium due to the accumulation of genetic alterations and is at high risk of progressing to squamous cell carcinoma.
[6] MTN score: In this study, MTN score refers to the diagnostic score generated by a multitask deep learning network (MTN) in multimodal optical imaging for cancer diagnosis. MTN score is a microscopic image computed on a frame-by-frame basis and used to assess the likelihood of abnormal cell morphology based on features observed in the image, such as nuclear morphology and tissue structure.
[7] Dysplasia: An abnormality in the process of cell division and differentiation to produce organs, resulting in the failure of organs to form normally.
[8] Invasive squamous cell carcinoma: A stage of cancer where the cancer originating from epithelial cells invades the stroma by breaking through the basement membrane.
[9] Frame Rate: An important metric indicating the number of images captured per second. Using a high frame rate microscope can reduce the time needed to measure a single area and extend the measurement range.
[10] Treatment-related morbidity: The original meaning of this term is “death that occurred during treatment at a medical institution” to distinguish it from ordinary deaths from illness, but the author’s intention in this paper seems to be to use the term to mean “death after treatment has started”. If cancer is not detected early, the cancer is often at an advanced stage, so it is highly possible that treatment (surgery, etc.) will be more invasive, and treatment-related deaths may increase.
[11] Patient outcomes: Refers to the state a patient reaches as a result of the progression of a disease and treatment. Specifically, it refers to the final outcome of the disease or condition, such as recovery, worsening, chronicity, or death.
innovative Photonics Evolution Research Center (iPERC)
3-5-1 Johoku, Chuo-ku, Hamamatsu, Shizuoka 432-8011 Japan
phone: +81-53-478-3271 / fax: +81-53-478-3256


